The Express Custom Reports option (see Figure 85)was designed to give the user the ability to create unlimited custom reports using information from any of the fields located in the Evidence Log. The custom report writer was created so an average person can design complex reports. You don’t have to be a programmer or computer expert to become efficient with express custom reports.
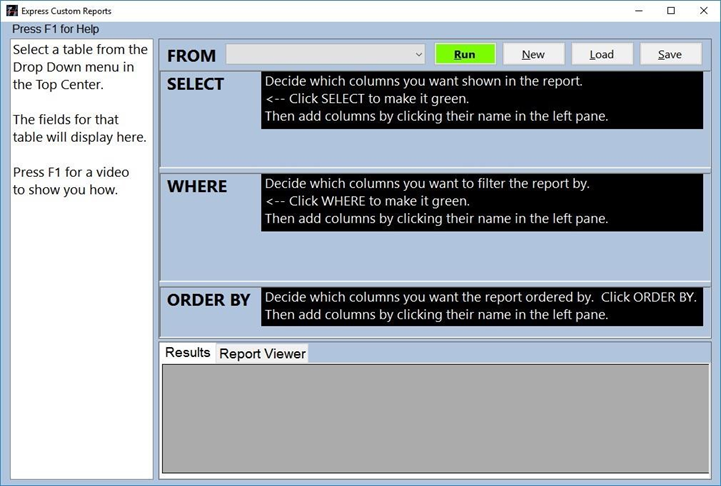
To create a Custom Report, select the Reports tab located on the main screen, then select Express Custom Reports (Ctrl+F11). Once the custom report screen opens, select an option in the FROM drop-down list (see Figure 86); (Evidence Log, Asset Log, Archive Log, Activity Log, and Evidence Detail Log).

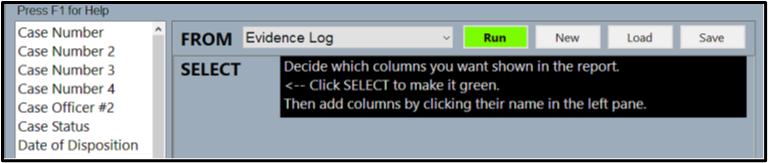
After you have selected one of the options from the drop-down list, you will need to choose the fields from the list in the left pane that you want to include in the report. SELECT field (see Figure 87).
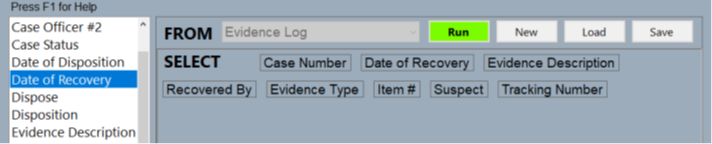
For example, if you want a report that includes a case number, date of recovery, evidence description, evidence type, item #, suspect, and the tracking number, you simply follow the instructions and select the fields you want to include from the left pane. First, choose SELECT by clicking on it with your mouse button. Next, choose the desired fields in the order that you want them to appear on the report (see Figure 88).
If you want to refine the information regarding a selected field, you need to click WHERE and then select the field from the left pane in order to filter the information (see Figure 89).
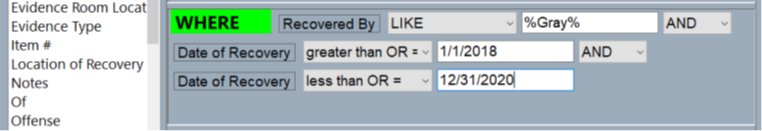
Figure 89
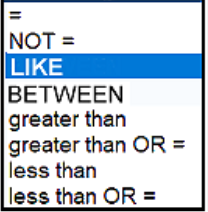
Once you have selected a field from the left pane, you will need to choose an option from the drop-down list to establish how you want to filter the information. There are 8 options to choose from and the available comparisons are as follows:
- = Use this option for exact data. (If the user wants to set the criteria where a field is blank, they need to use the = for the comparison option and then leave the criteria field blank). Not applicable for date fields.
- NOT = (use date or text fields for an exact comparison).
- LIKE (choose the LIKE to search for word(s) see Figure 90). Can also use wild cards.
- BETWEEN (used for date fields)
- greater than (used for date fields)
- greater than OR = (used for date fields)
- less Than (used for date fields)
- less than OR = (used for date fields)
The LIKE option will allow you to include wildcards (%) to help you find information when you may not know the exact spelling or how it may have been entered when the record was created. For example, if you choose the field Recovered By and using the filter LIKE and then enter [%Gray%] the program will display every record where Grayson, Dick Grayson, D. Grayson, Grayson D or where Gray is listed anywhere in the text string.
Once you have selected the type of filter to use, you need to select what the criteria will be. Criteria can be but is not limited to:
- Date – mm/dd/yyyy
- Word – ex. Guns
- Blank – when the user wants to pull all data that has that particular field blank or empty.
- Wildcard Search – use a % as a wildcard along with the key letter(s) or word(s).
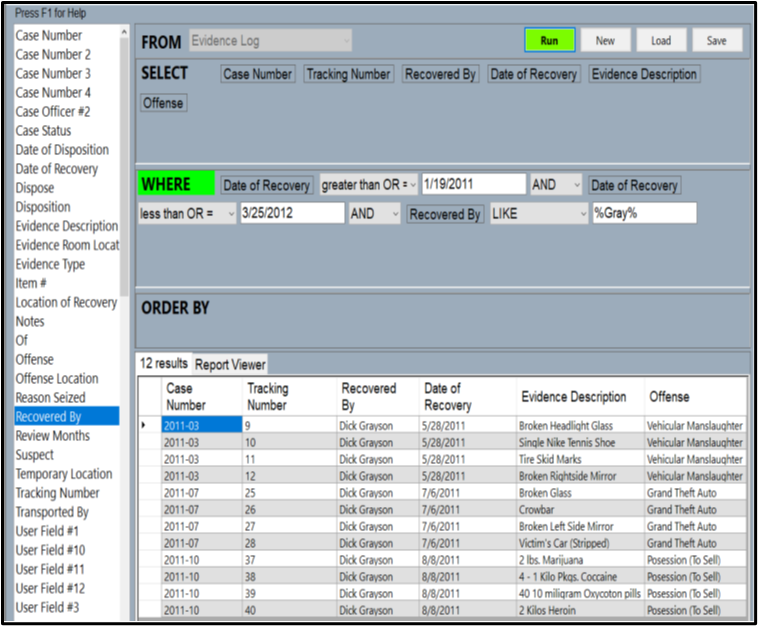
Once you have set the desired parameters, you need to select Run at the top of the window to run the report. The requested data will be displayed in the data table at the bottom of the window (see Figure 91). Please, also notice how the data is displayed, the report is displaying the data in ORDER BY which you have chosen the fields beginning with Case Number.
You could Highlight data in the table by moving your mouse to the area you want to copy, press and hold down the left mouse button and then drag the cursor across the field, columns and/or rows that you want to copy. If you then Press Control, then C on your computer keyboard you can copy the data to paste into another document. Most departments have various standard letters, forms and other documents where they can use the copy paste feature to save time.
If you want to create a report from a Custom Report you can do that by selecting Report Viewer to create the report and see what it will look like before printing or exporting, (see Figure 92). You can even include signature lines at the bottom of the report if you choose.
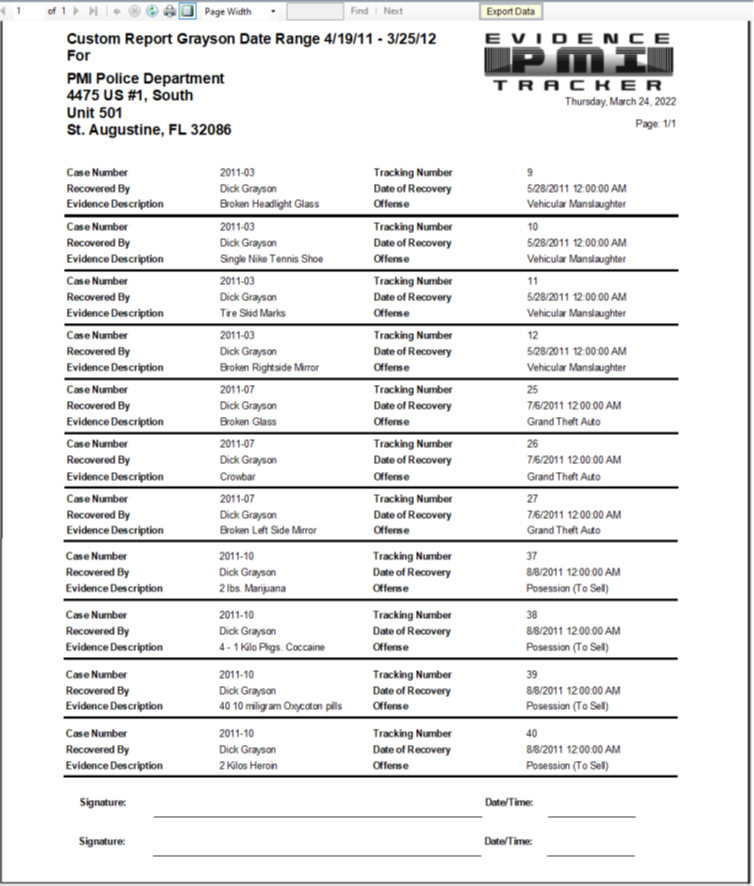
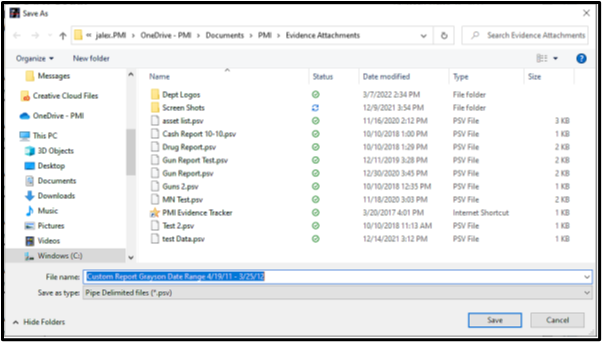
The user can also export any custom report by selecting the Export Data option at the top of the window, then creating a name for the report (see Figure 93). The file will then be saved in an Excel format where you can generate statistical values for the various columns. The default configuration is in a (*.psv) ~ Pipe Delimited Format. You can also create a .pdf file and attach the document to an email, to be distribute to one or multiple recipients, or you can simply print it out.