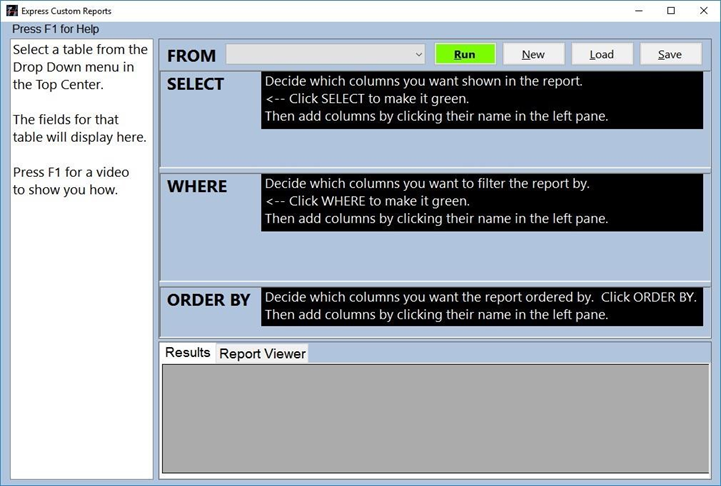
The Express Custom Reports option (see Figure 85)was designed to give the user the ability to create unlimited custom reports using information from any of the fields located in the Evidence Log. The custom report writer was created so an average person can design complex reports. You don’t have to be a programmer or computer expert to become efficient with express custom reports.
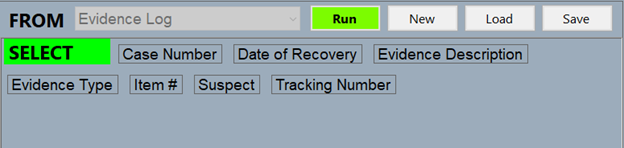
To create a Custom Report, select the Reports tab located on the main screen, then select Express Custom Reports (Ctrl+F11). Once the custom report screen opens, select an option in the FROM drop-down list (see Figure 86); (Evidence Log, Asset Log, Archive Log, Activity Log, and Evidence Detail Log).
Figure 86
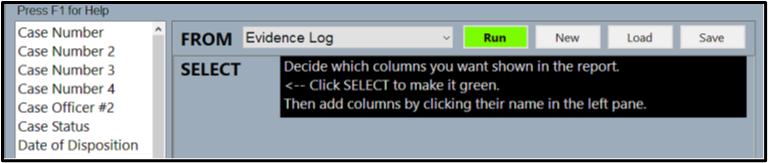
After you have selected one of the options from the drop-down list, you will need to choose the fields from the list in the left pane that you want to include in the report. SELECT field (see Figure 87).
Figure 87
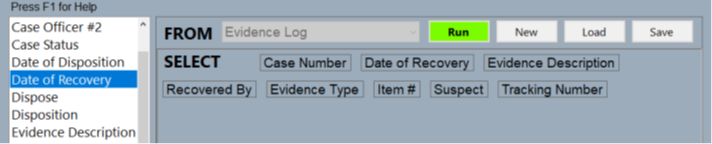
For example, if you want a report that includes a case number, date of recovery, evidence description, evidence type, item #, suspect, and the tracking number, you simply follow the instructions and select the fields you want to include from the left pane. First, choose SELECT by clicking on it with your mouse button. Next, choose the desired fields in the order that you want them to appear on the report (see Figure 88).
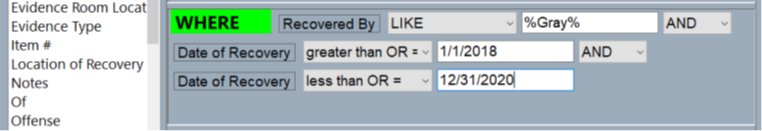
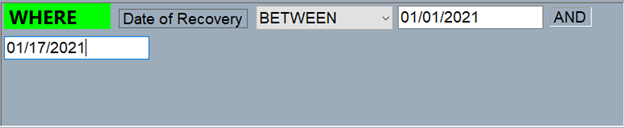
If you want to refine the information regarding a selected field, you need to click WHERE and then select the field from the left pane in order to filter the information (see Figure 89).
Figure 89
Figure 89
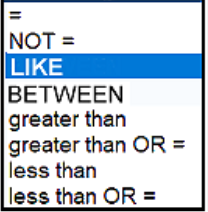
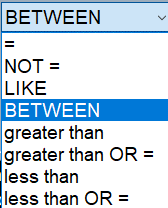
Once you have selected a field from the left pane, you will need to choose an option from the drop-down list to establish how you want to filter the information. There are 8 options to choose from and the available comparisons are as follows:
= Use this option for exact data. (If the user wants to set the criteria where a field is blank, they need to use the = for the comparison option and then leave the criteria field blank). Not applicable for date fields.
NOT = (use date or text fields for an exact comparison).
LIKE (choose the LIKE to search for word(s) see Figure 90). Can also use wild cards.
BETWEEN (used for date fields)
greater than (used for date fields)
greater than OR = (used for date fields)
less Than (used for date fields)
less than OR = (used for date fields)
Figure 90
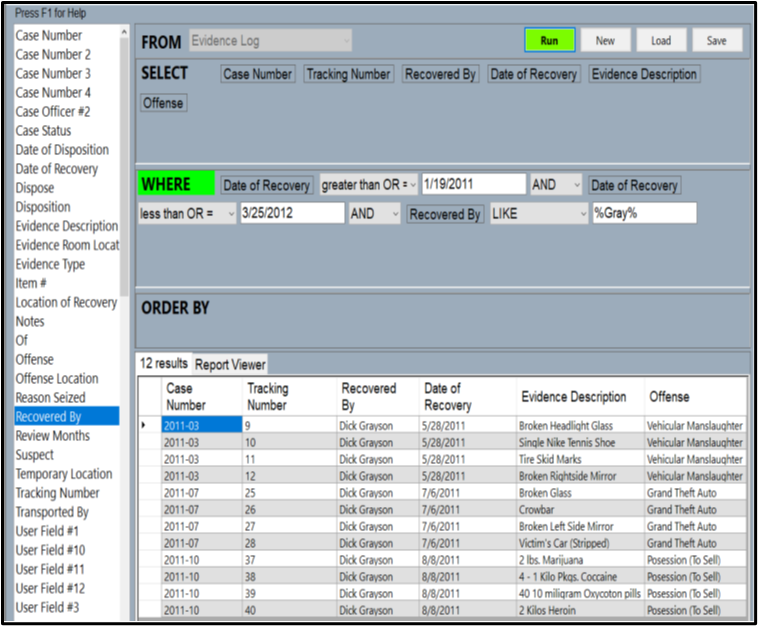
The LIKE option will allow you to include wildcards (%) to help you find information when you may not know the exact spelling or how it may have been entered when the record was created. For example, if you choose the field Recovered By and using the filter LIKE and then enter [%Gray%] the program will display every record where Grayson, Dick Grayson, D. Grayson, Grayson D or where Gray is listed anywhere in the text string.
Once you have selected the type of filter to use, you need to select what the criteria will be. Criteria can be but is not limited to:
Date – mm/dd/yyyy
Word – ex. Guns
Blank – when the user wants to pull all data that has that particular field blank or empty.
Wildcard Search – use a % as a wildcard along with the key letter(s) or word(s).
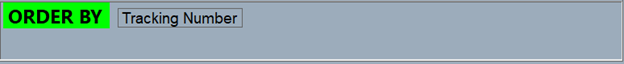
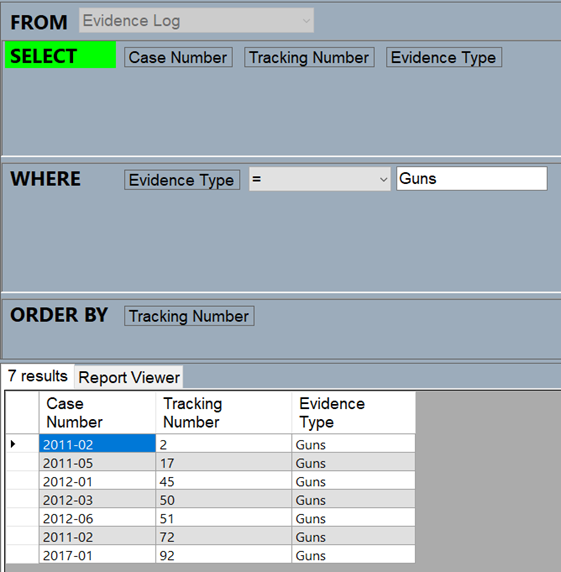
Once you have set the desired parameters, you need to select Run at the top of the window to run the report. The requested data will be displayed in the data table at the bottom of the window (see Figure 91). Please, also notice how the data is displayed, the report is displaying the data in ORDER BY which you have chosen the fields beginning with Case Number.
Figure 91
You could Highlight data in the table by moving your mouse to the area you want to copy, press and hold down the left mouse button and then drag the cursor across the field, columns and/or rows that you want to copy. If you then Press Control, then C on your computer keyboard you can copy the data to paste into another document. Most departments have various standard letters, forms and other documents where they can use the copy paste feature to save time.
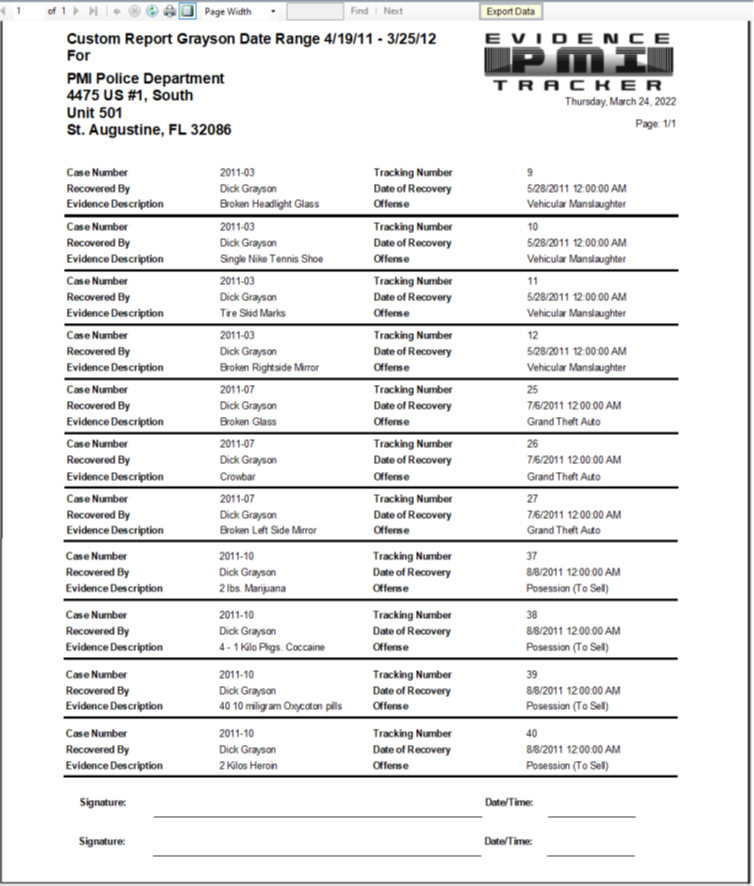
If you want to create a report from a Custom Report you can do that by selecting Report Viewer to create the report and see what it will look like before printing or exporting, (see Figure 92). You can even include signature lines at the bottom of the report if you choose.
Figure 92
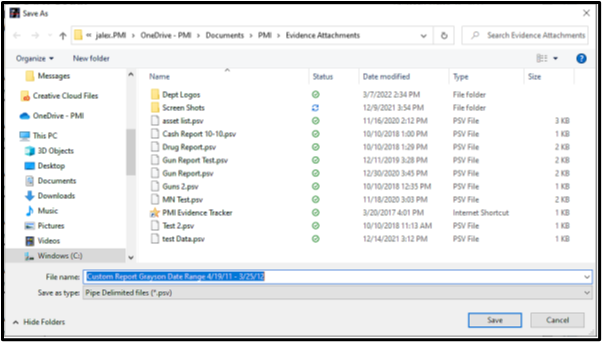
The user can also export any custom report by selecting the Export Data option at the top of the window, then creating a name for the report (see Figure 93). The file will then be saved in an Excel format where you can generate statistical values for the various columns. The default configuration is in a (*.psv) ~ Pipe Delimited Format. You can also create a .pdf file and attach the document to an email, to be distribute to one or multiple recipients, or you can simply print it out.
The “Activity Report” will present the user with a screen (see figure 94) that lists all users under “User ID.” The user will select the username in question then input a “Start Date,” “End Date,” or enter “Free Text.” Once the desired parameters are entered, the user can then select “Create Report.”
Figure 94
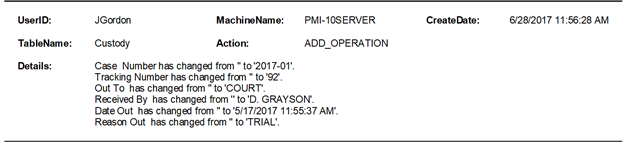
The report will display all actions the user performed (see figure 95) while logged into the PMI Evidence Tracker™ application. This is also known as an audit trail.
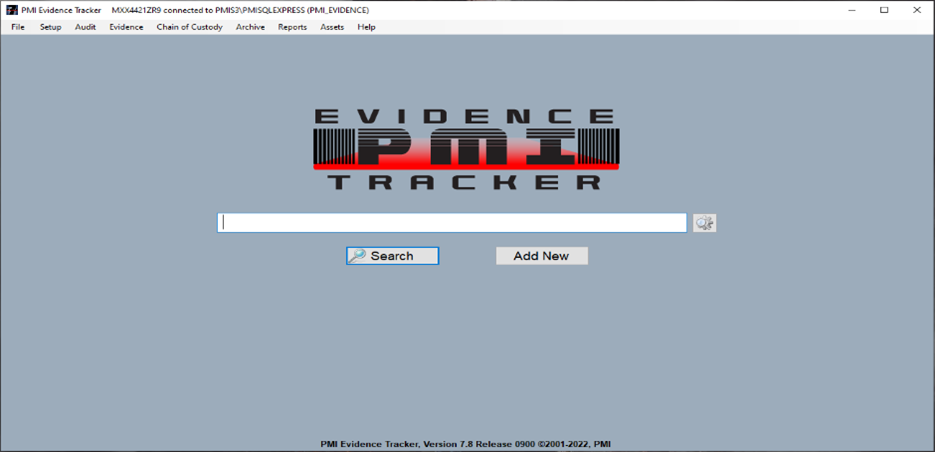
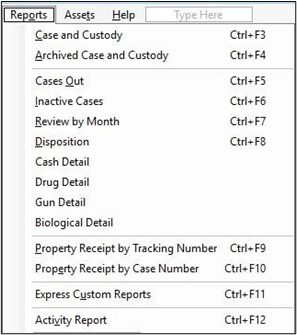
The “Reports” tab has six pre-designed reports (see figure 65) that will help the user organize and maintain the evidence/property room. Please don’t forget to set the proper permissions for users to use the application as the administrator wishes.
Figure 65
Case and custody report
The “Case and Custody” will present the user with (see figure 66) a window that will list all active items and case numbers for the user to choose from. The user can select “Report on Selected Item,” “Report on Selected Case,” “Filter List,” or “Report from Case #.”
Once a case number or item in a case has been selected, the user will need to select one of the previously listed options. Once the report is generated, it provides documentation that can be placed in a case file or given to an individual their records.
Figure 66
The “Report on Selected Item” option will produce information regarding the item selected and its’ chain of custody log. The “Report on Selected Case” option will generate a report for ALL items listed under the selected case number and each items chain of custody records. The “Filter List” option enables the user to filter the information displayed in the list down to a case number that might have many items related to it. The “Report from Case #” (see figure 67) option will enable the user to enter the case number they wish to view case and custody information for.
Once the desired report is displayed and the user has all the information they need. They can choose to print the report by selecting the printer icon in the upper middle of the report screen. Another way to run the report is to highlight the desired case number and click onto the “Report on Selected Case.” This gives you a report of all records in the case. A third way to run the report is to click onto the “Filter List” button and it gives you a drop-down to select by Case Number or by Tracking Number. A fourth way to run the report is to click onto the “Report from Case Number” button and a case number input screen will be displayed. Enter the case number you want to run a report on and click the “OK” button.
Figure 67
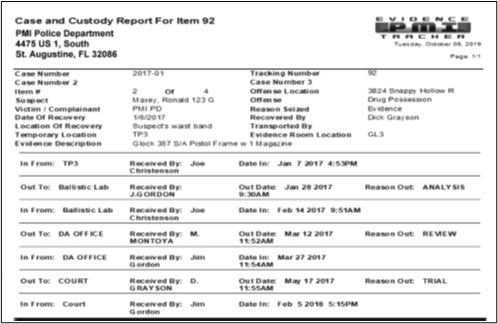
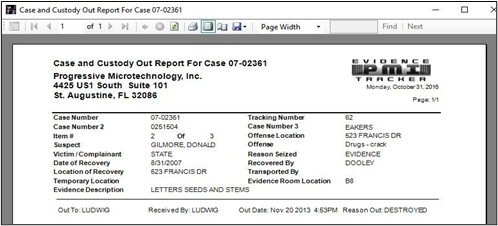
The “Case and Custody”report (see figure 68) will show the case number, the department information, and the current date at the top of the report. Each piece of evidence will be listed numerically by tracking number and will display information on each item in the case along with all chain of custody logs.
Figure 68
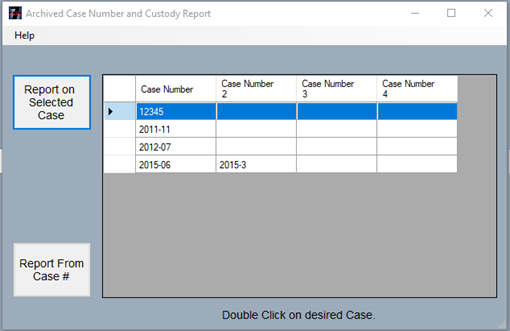
Archive Case and custody report
The “Archive Case and Custody” report (see figure 69) is structured similar to the “Case and Custody” report previously described with one exception; it only generates reports on cases that are archived. To run a report on an individual case number, the user will select “Report on Selected Case.” If the user would like a report generated by inputting a case number, they can select the bottom option “Report from Case #.” The steps are identical to the steps listed in the “Case and Custody” report.
Figure 69
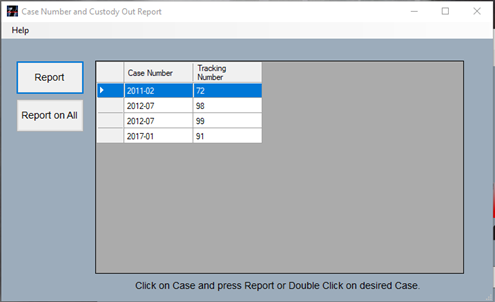
Case Out report
The “Cases Out” report (see figure 70) will generate a report on an item that have been batched out from the evidence/property room and not yet returned.
Figure 70
The report (see figure 71) header will display the report title, the department information, date stamp, and page count. The report will display the information on each piece listed and the batch out information regarding to its’ location. The user can generate a “Cases Out” report at any time to display which pieces of evidence that are checked out of the evidence/property room. To generate a report for all items currently logged out, the user will select the “Report on All” option, and it will display a report on all the records that are out of the evidence/property room.
Figure 71
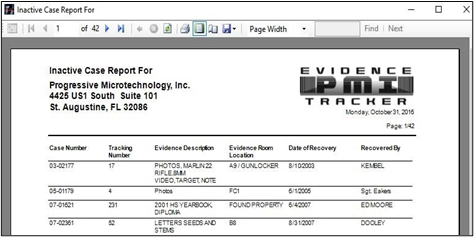
Inactive cases report
The “Inactive Cases” report (see figure 72) will display all cases marked as “Inactive” in the “Evidence Log.” The “Inactive Cases” report header displays the report title, the department information, a date stamp, and page count. The report includes the “Case Number,”“Tracking Number,”“Evidence Description,” “Evidence Room Location,”“Date of Recovery,” and “Recovered By.” The “Inactive Cases” report can provide the user a list of items that can be disposed of or decide which cases can be archived.
Figure 72
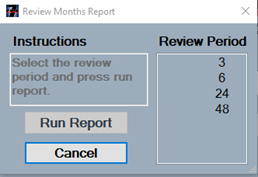
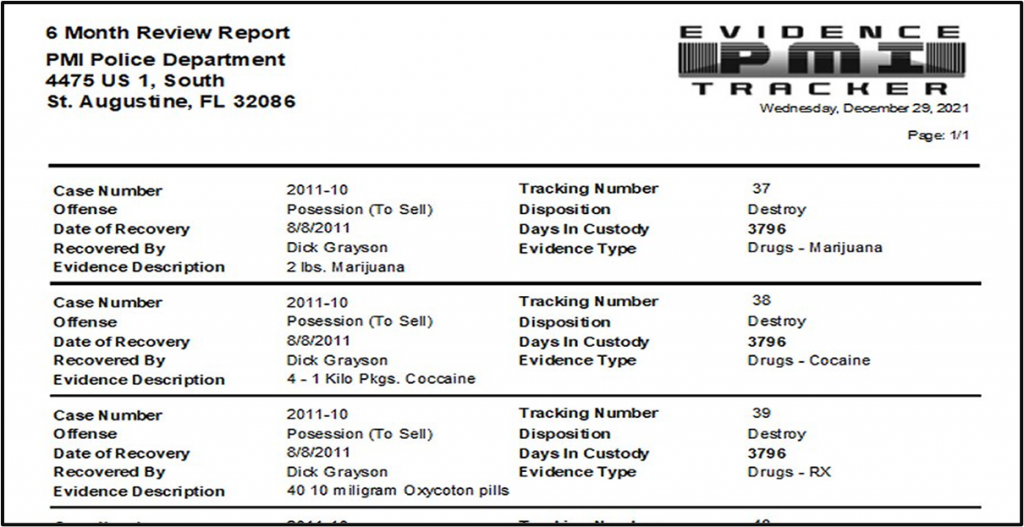
Review By Month Report
The “Review by Month” report (see figure 73) will display a window for the user to select a “Review Period,” then the user will select “Run Report.”
Figure 73
The report (see figure 74) will generate a list of items in the evidence/property room with a status tagged for review based on the number of months that were selected in the record. The report is often required by Local, State, and Federal jurisdictions for maintaining an accurate count for “Guns,” “Drugs,” “Cash,” and “Biological” items.
Figure 74
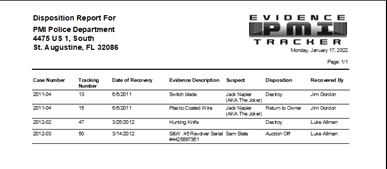
Disposition Report
The “Disposition” report (see figure 75) will generate a report on items where the user selected the “Dispose” checkbox. The checkbox is used to indicate the intention to dispose of the item later and is how the application will recall the items to generate the “Disposition” report.
Figure 75
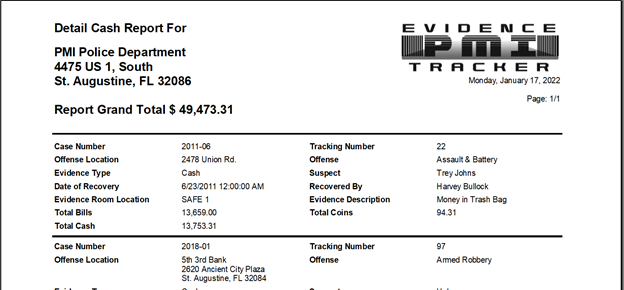
Cash detail report
The “Cash Detail” report (see figure 76) is a detailed list of all pieces of evidence that have been tagged as “Cash” in the “Evidence Type” field. This report gives the user a grand total of cash logged into the evidence/property room at the top left under the department information. The information listed in the report for each case number will provide the user with a total bill count, a total coin count, and a grand total listed under the case number. This feature only works if the user inputs the necessary information in the trigger window after selecting “Cash” as the “Evidence Type,” and the user inputs the correct bill and coin count. The “Cash Detail” report can be used as a quick cash audit for the evidence/property room.
Figure 76
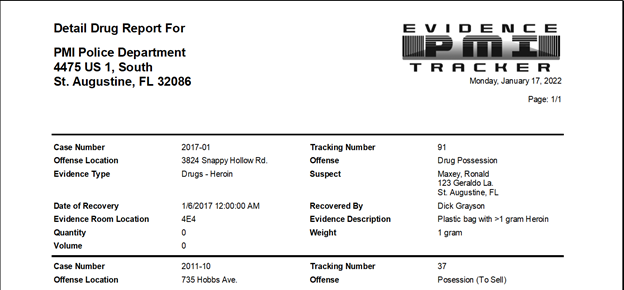
Drug Detail Report
The “Drug Detail” report (see figure 77) will list all pieces of evidence that are tagged as “Drugs” in the “Evidence Type” field. This report gives the user details relating to each piece of evidence including the quantity, weight, or volume.
Figure 77
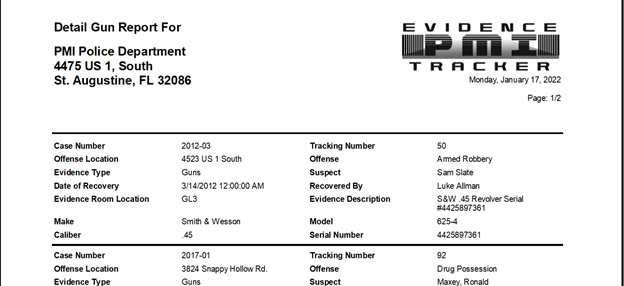
Gun Detail report
The “Gun Detail” report (see figure 78) will display gun detail information about every piece of evidence in the evidence/property room that has been categorized as “Guns” in the “Evidence Type” field. This report provides the user with detailed information including the Make, Model, Caliber, and Serial Number of each gun entered if the record creator input the information.
Figure 78
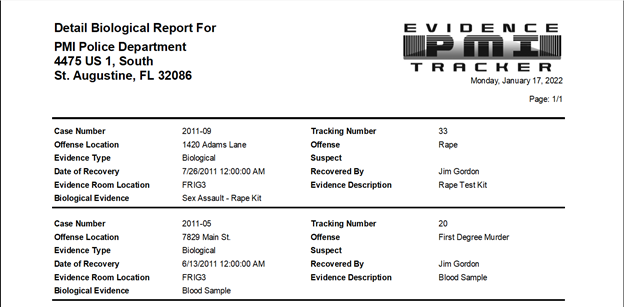
Biological detail report
The “Biological Detail” report(see figure 79) will display a list of all pieces of evidence that are tagged as “Biological” in the “Evidence Type” field. This report provides the user with detailed information as to the type of biological substance has been recovered.
Figure 79
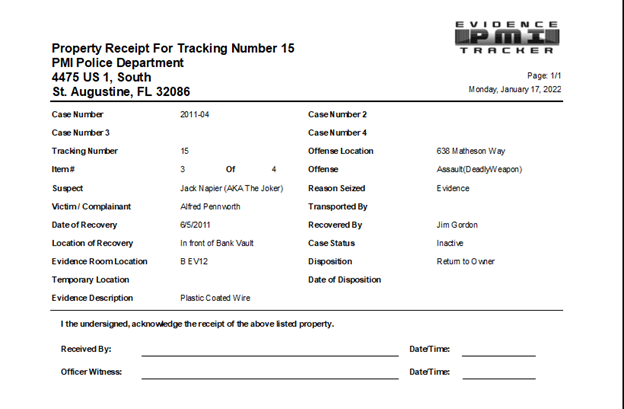
Property reciept by tracking number
The “Property Receipt by Tracking Number” (see figure 80) is a receipt the user can print that will display all the information pertaining to the tracking number they input in the search bar (see figure 81). As shown in the figure below, the receipt has two signature lines, one for “Received By” and the other “Officer Witness.”
Figure 81
Figure 80
Property receipt by case number
The “Property Receipt by Case Number” (see figure 82) is similar to the “Property Receipt by Tracking Number” except instead of entering a tracking number, the user only enters a case number for which they want to create a receipt. One receipt will be generated listing all the pieces of evidence entered under the selected case number in the “Evidence Log.”
Figure 82
Express Custom Reports
The “Express Custom Reports” option (see figure 83) was designed to give the user the ability to create various reports using information from any of the fields located in the “Evidence Log.”
Figure 83
Creating a custom report
To create a “Custom Report,” select “Reports” located on the main screen, then select “Express Custom Reports” (Ctrl+F11). Once the custom report screen opens (see figure 83), select an option from the “FROM” drop-down list (see figure 84); (Evidence Log, Asset Log, Archive Log, Activity Log, and Evidence Detail Log).
Figure 84
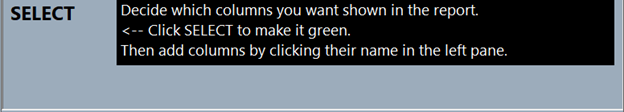
After the user has selected one of the options from the drop-down list, they will then need to add field headers to the “SELECT” field (see figure 85). The user will need to select field headers from the list in the left pane that they want the information from displayed on the report. For example, if the user needs information about case number, date of recovery, evidence description, evidence type, item#, suspect, and the tracking number, they will select those field headers from the left pane. First the user will need to select “SELECT” by clicking on it with the left mouse button. Once “SELECT” is selected it will highlight in green. The user will then select, by their desired order, the field header names they wish to recall information about (see figure 86).
Figure 85
Figure 86
If the user has specific information they wish to find, the user will use the “WHERE” field to filter the information before the information is recalled for viewing. This is accomplished by selecting “WHERE” then, selecting an option from the left pane (see figure 87). Once the user has selected a field header from the left pane, they will need to select an option from the drop-down list i.e., “BETWEEN.” There are eight options to choose from (see figure 88).
Figure 87
The “LIKE” option will allow the user to use “wildcards” (%) to help them find information they may not know the exact spelling or information. i.e., Evidence Type LIKE [“%Gen”] will produce any record with an Evidence Type like General, general, or any words listed in the Evidence Type that start with “gen.” This can be especially useful if spelling is questioned.
comparison and criteria
If the user wants to filter the selected field information to only include certain conditions are met, they will need to select “WHERE.” Next the user will select which field they want to use to filter the data. By clicking on a field header in the left pane. If the user selects the down-down, they will see a list of 8 options to choose from.
Figure 88
The available comparisons are:
“=” Use this option for exact data. (If the user wants to set the criteria where a field is blank, they need to use the “=” for the comparison option and then leave the criteria field blank.) Not applicable for date fields.
“NOT =” (use date or text fields for an exact comparison).
“LIKE” (choose the “LIKE” to search for word(s)) (see figure 89) Can also use wild cards.
“BETWEEN” (used for date fields)
“greater than” (used for date fields)
“greater than OR =” (used for date fields)
“less Than” (used for date fields)
“less than OR =” (used for date fields)
Figure 89
Once the user has selected the type of comparison to use, they need to select what the criteria will be.
Criteria can be but is not limited to:
Date – mm/dd/yyyy
Word – ex. “Guns”
Blank – when the user wants to pull all data that has that particular field blank or empty.
Wildcard Search – use a “%” as a “wildcard” along with the key letter(s) or word(s).
Then select “ORDER BY” and select the fields (again from the left side column) the user wants to order the report by. This puts the information of the report in the specific order that the user chooses. (See figure 90).
Figure 90
Once the has set the desired parameters, the user will select “Run” at the top of the window to run the report. The raw data will show up in the data matrix at the bottom of the window (see figure 91). Please, also notice how the data is displayed, the report is displaying the data in “ORDER BY” tracking number.
Figure 91
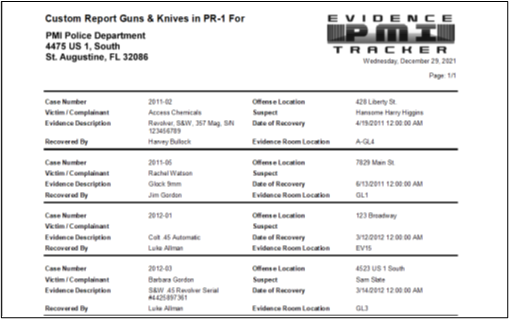
The user can then select “Report View” to view (see figure 92) what the report will look like before printing or exporting it.
Figure 92
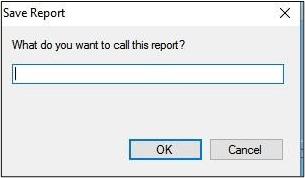
The user can also save their “custom report” by selecting “Save” at the top of the window then creating a name for the report (see figure 93).
Figure 93
Activity report
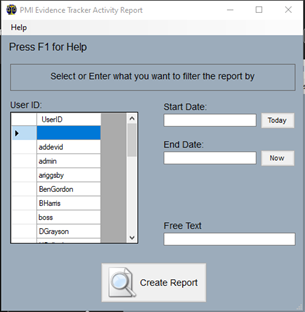
The “Activity Report” will present the user with a screen (see figure 94) that lists all users under “User ID.” The user will select the username in question then input a “Start Date,” “End Date,” or enter “Free Text.” Once the desired parameters are entered, the user can then select “Create Report.”
Figure 94
The report will display all actions the user performed (see figure 95) while logged into the PMI Evidence Tracker™ application. This is also known as an audit trail.
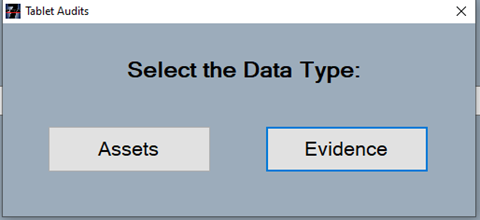
If the user selects the “Tablet Audits” option, the user will be prompted to select either “Assets” or “Evidence” (see figure 26). This option is only available if your department purchased the tablet application software.
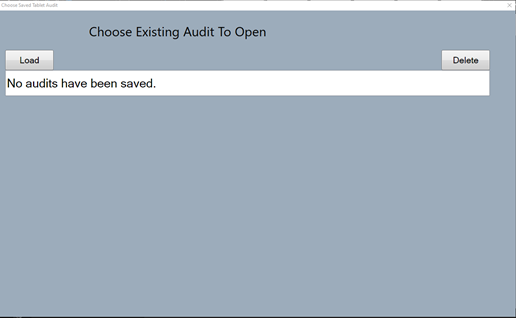
If the user selects “Assets” or “Evidence,” a new window will appear that allows the user to load or delete either an asset or evidence audit (see figure 27) previously saved from an audit conducted with the tablet application. If the user chooses to load an audit, it will show the results of the audit conducted from the tablet after it is synced with the database.